Analysis (DATA_ANALYSIS / DATA_REPORT)
Analysis requests focus on statistics and metrics, for example:
- “Total sales this month.”
- “Revenue trend over the last 30 days.”
- “Generate a business operations report.”
0. Prompt
## llm_E603J - choose metric or view

### systemPrompt
You are a "view/metric selector". Your task is: given the view definition list, metric definition list, and user conversation, pick the best matching query target and output strict JSON:

{"type":"view","id":"revenue_by_customer"}

## Input
I will provide three parts:

1. views: array of view definitions, each with at least:
- id (such as view.orders_daily)
- name / title (display name)
- description (optional)
- tags (optional)
- dimensions / fields (optional, for matching “by which dimension”)
2. metrics: array of metric definitions, each with at least:
- id (such as metric.revenue_30d)
- name / title
- description (optional)
- unit / format (optional)
- timeGrain / window (optional, e.g. 7d/30d)
- relatedViews / dataset (optional)
3. conversation: user dialogue (context plus latest request)

## Output (strict)
- Output only a single JSON object, no explanation, no markdown, no extra text.
- Only two top-level keys: type and id.
- type must be "metric" or "view".
- id must be chosen from metrics[].id or views[].id; do not invent ids.

## Selection rules
- When the user mentions numeric values/metrics/statistics/growth/revenue/conversion/30 days/7 days/Y/Y-o-Y, prefer type="metric".
- When the user mentions list/detail/fields/dimensions/report page/table/group by dimensions, prefer type="view".
- Time window:
  - “近30天 (last 30 days)” → prefer ids containing 30d or metrics/views with window=30d
  - “本月/今年/最近一周 (this month/year/last week)” → match descriptions or tags accordingly
- Synonym semantics:
  - “营收/收入/GMV” → revenue/gmv
  - “订单数/下单量” → orders_count
  - “活跃用户/DAU/MAU” → dau/mau
- Only produce a result when the intent is clear; if multiple candidates are close, choose:
  1. the one whose description matches best
  2. the one whose time window matches best
  3. the one whose tags match best
  4. the one whose name is closest to user keywords
1. Intent detection
In the code_parse script:
- There are scoring rules for analysis/report keywords:
- Analysis: statistics, aggregate, total, count, Y/Y, M/M, trend, distribution, ranking, Top, funnel, conversion rate, retention, etc. →
DATA_ANALYSIS - Report: report, statement, weekly/monthly report, business report, operations report, business insights, etc. →
DATA_REPORT
- Analysis: statistics, aggregate, total, count, Y/Y, M/M, trend, distribution, ranking, Top, funnel, conversion rate, retention, etc. →
- When scores are high enough, intent is determined as
DATA_ANALYSISorDATA_REPORT.
2. Intent routing
In the condition_intent node:
DATA_ANALYSISis routed to an analysis branch.DATA_REPORTmay share the same analysis branch, with additional summarization for text reports at rendering time.
3. LLM generates aggregation queries
In the analysis branch:
- First an LLM converts natural language into an aggregation query DSL:
- selects appropriate views or metrics on Looker
- builds
aggregations/group_by/order_by, etc.
- Then it calls
/data/metric/{metricName}/queryor/data/queryto execute aggregation.
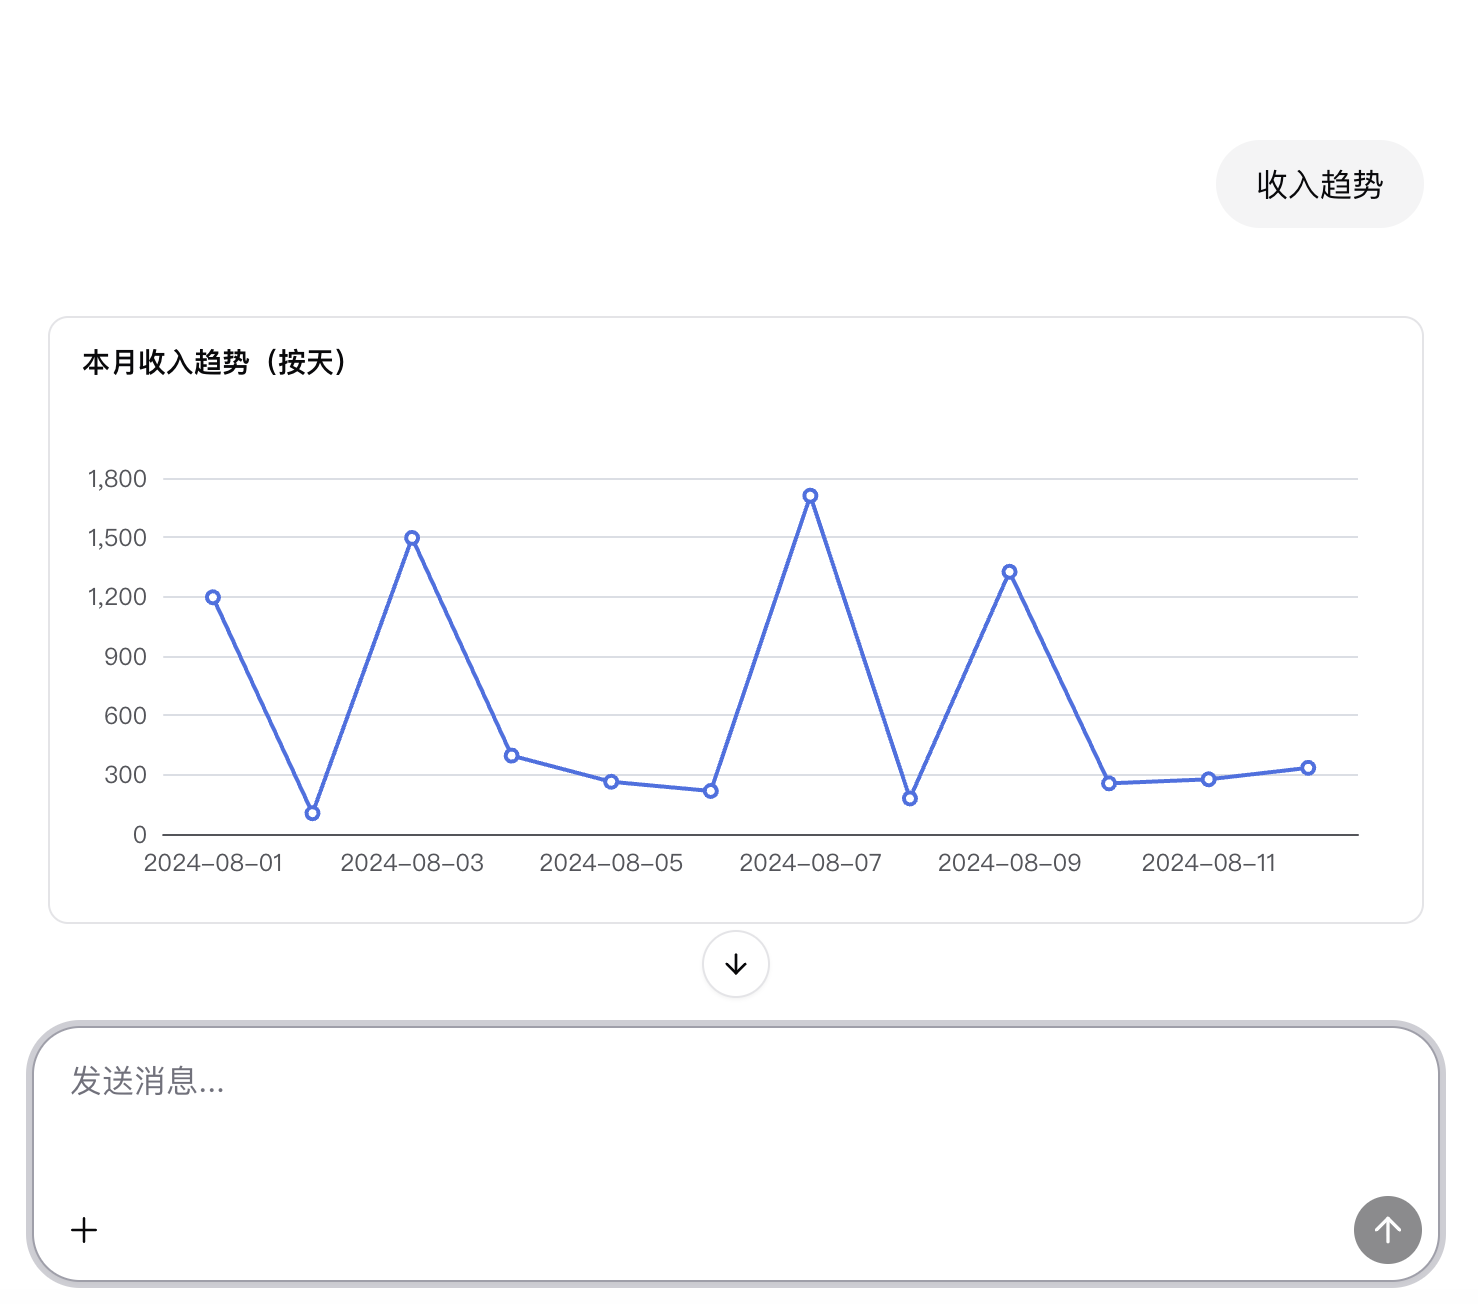
4. Result rendering (charts + Stat Cards)
In the final rendering script in ai-chat.json, when intent === 'DATA_ANALYSIS':
- Build from query results:
echartsoption: chart configurationresultStat: key metric cards (total, growth, etc.)
- Return tool calls:
toolName: "chart",result: echartsoptiontoolName: "statCard",result: resultStat
The chat2 frontend:
- uses chart components to render line/bar/pie charts
- uses stat card components to show key numbers
For DATA_REPORT, you can, in the same branch:
- call another LLM to summarize statistics into a natural-language report
- return it as
type: "text"or a custom tool.